Exploring the MATLAB desktop
A quick overview of the MATLAB desktop
Command Window
The command window is the area in MATLAB where you can type MATLAB code and have it immediately execute. Try it now.
Enter the following in the command window:
After you hit enter, you get a response from MATLAB, as follows
…This tells you what MATLAB did — it assigns the value 1 to the variable a.
Workspace
The workspace helps you keep track of the variables you have assigned, in a table format. In the previous example, we created the variable a. This variable is now listed in the workspace.
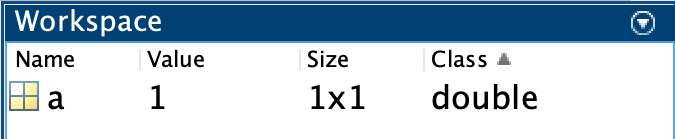
Notice:
- There is one row in the Workspace
- There is information like the name of the variable (a), its value, the size, number of bytes, and class
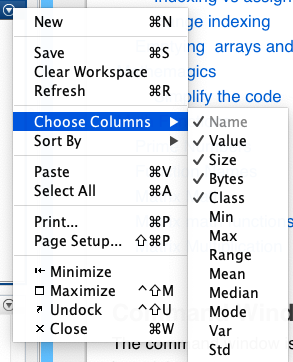
To modify what is shown in the workspace, you can add or remove columns in the table by clicking on the inverted triangle in the Workspace header to bring up the contextual menu. Under the "Choose Columns" submenu, select the following:
Variable Editor
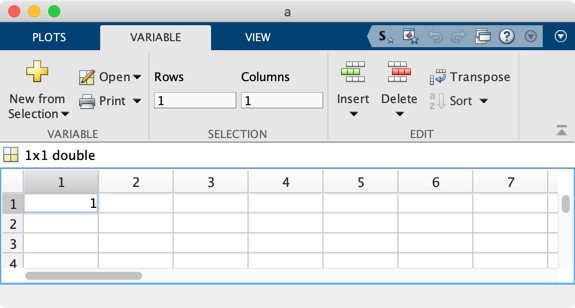
Double-clicking on a variable in the workspace brings up the Variable Editor. Here, you can edit or copy variable content as if you were using a spreadsheet editor.
Ribbon Interface
MATLAB has a context-sensitive toolbar called the ribbon interface.
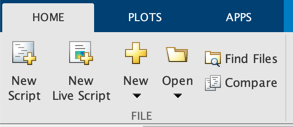
- We will often refer to this interface.
- Notice in the image above that we have the Home tab selected
Current Folder
At launch, MATLAB opens a folder on your hard drive. You can see a reference to this folder just below the ribbon strip, in the address bar:

- Here, the address bar indicates that the current folder is the MATLAB drive (which is where we store our online files).
- You may see something along the lines of
~/Documents/Folderwhich points to a location on your hard drive
The Current Folder Window displays the contents of the current folder

- You can change which columns are shown in this window by clicking on the inverted triangle to bring up the contextual menu
- Notice as you navigate to other folders, the contents displayed changes
Documentation
You can bring up the MATLAB documentation in several ways.
-
You can enter a search term in the search bar (top right corner)

-
Or, you can click on the
?icon (which you can find next to the search bar or in the Home tab in the ribbon strip) -
Or, you can type
docin the command window
| Get Help | |
|---|---|
Important Preferences
The following settings can improve the performance of MATLAB for certain tasks, especially later in the course. Let's set them now, before we forget.
Java Heap Memory
MATLAB's desktop interface — the editor, workspace browser, figure windows, and documentation — runs on top of the Java Virtual Machine (JVM). Java Heap Memory is the block of RAM allocated to the JVM for these components. When it runs low, the desktop can slow down, freeze, or produce java.lang.OutOfMemoryError warnings. This becomes especially noticeable when working with large images or interactive visualization tools later in the course.
Increasing the heap size gives the JVM more headroom. The change takes effect after restarting MATLAB.
- Click on the Home Tab

- Select the preferences icon:

- Under General: Java Heap memory, drag the slider all the way to the right
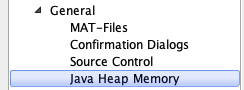
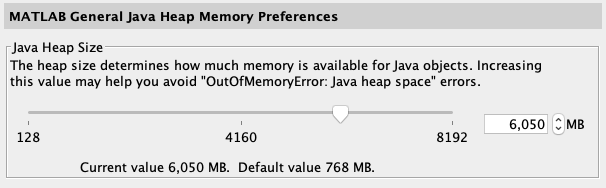
Image Processing Toolbox settings
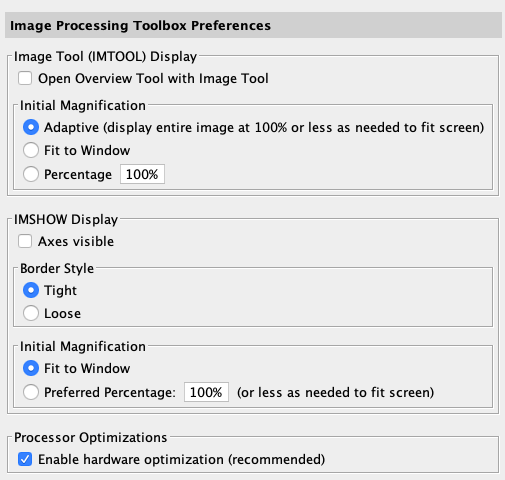
These settings control how imshow displays images in MATLAB. Configuring them now ensures images are displayed consistently throughout the course.
Adaptive Initial Magnification — When enabled, MATLAB automatically adjusts the zoom level of a displayed image based on your screen size and the figure window size. Without this, a very large image (e.g., a high-resolution medical scan) may open at 100% zoom and extend far beyond the screen, making it hard to work with.
Border Style: Tight — By default, MATLAB adds padding around the image inside the figure window. Setting the border style to Tight removes that whitespace so the axes fit snugly around the image. This is especially useful in image processing, where extra padding can be distracting and makes it harder to judge image boundaries.
Initial Magnification: Fit to Window — This scales the image to fit within the current figure window when first displayed, regardless of the image's actual pixel dimensions. Combined with Adaptive Initial Magnification, this ensures images always open at a usable size.
Live Scripts
In this course, we will primarily use MATLAB Live Scripts. Live Scripts are interactive documents that combine MATLAB code with formatted text. These scripts are organized into sections called Code Sections. Each section runs independently from the other sections. You select a section by simply clicking inside that block. Once selected, the section is outlined by blue (as opposed to light gray).
Code blocks
Code blocks contain lines of MATLAB code, such as the following.
Output location
After you execute the code in a section, you should see some output as you would in the command window. The location of this output can either be below the code block or to the right of the code block. This position is controlled by the pair of buttons on the top right side of the live script that looks like this:

If you hover over these buttons, you will see a tooltip string that states its function: "Show outputs on right" or "Show outputs inline".
Display Line Numbers
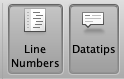
Under the View tab, you can select to display Line Numbers and Datatips. Do so now.
Breakpoints
In your script, each line of code in the code block will have a line number. If you click on the number, it will become highlighted in blue as shown here:

This will add a breakpoint to the script, pausing code execution at that location, and probably messing with your coding. If you have accidentally highlighted a number blue, simply click on the number again and the blue highlight will disappear, resuming normal execution of the code. You can also accidentally add a breakpoint with the key-combination command-\ on a Mac. So watch out for that.
Debugging controls
If you have a line number highlighted and execute the code block, you will enter debugging mode, which means that you manually have to advance the execution yourself.
In the Live Editor tool strip, there are three buttons you can press: Continue, Step, Stop
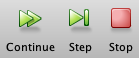
- Continue or Step will execute the paused line of code
- Clicking on the Stop Icon will stop the code without executing the paused line.
Comments
Sometimes you want to add a comment along with your code. The special character % indicates the start of a comment. Comments appear as green text.
…Notice that the comment is not executed.
Clearing Variables and the Command Window
Clear your workspace and the command window by executing the following commands:
Your variables are now gone! Don't worry, we'll make more.
Games and Stuff
Ok, break time. The following commands bring up hidden easter eggs in MATLAB. Try them all by copying and pasting the following commands in the command line.
| Play Sliding Puzzle | |
|---|---|
| Play Mine Sweeper | |
|---|---|
| Plot a 3D Knot | |
|---|---|
Plot a Heart
Copy and paste all three lines into the command line:
Answers to Life's most pressing question